
- Insight
- Posted
Six of one
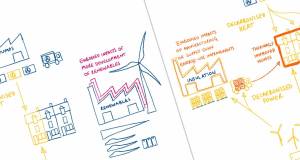
The climate emergency demands that we minimise the energy we use to operate buildings, as well as the energy we use to construct new buildings, where new buildings are needed. A Passive House Association of Ireland-commissioned analysis may start to shed some light on the embodied carbon impact that different build methods can have.
This article was originally published in issue 38 of Passive House Plus magazine. Want immediate access to all back issues and exclusive extra content? Click here to subscribe for as little as €20, or click here to receive the next issue free of charge
The embodied carbon of walls and foundations on new homes can be cut by 50 per cent or more, an analysis commissioned by Passive House Association of Ireland (PHAI) has revealed.
The PHAI commissioned the Association for Environment Conscious Building (AECB) to conduct the analysis using PHribbon, a tool which enables embodied carbon to be calculated via the PHPP passive house design software. The AECB calculated the cradle-to-grave
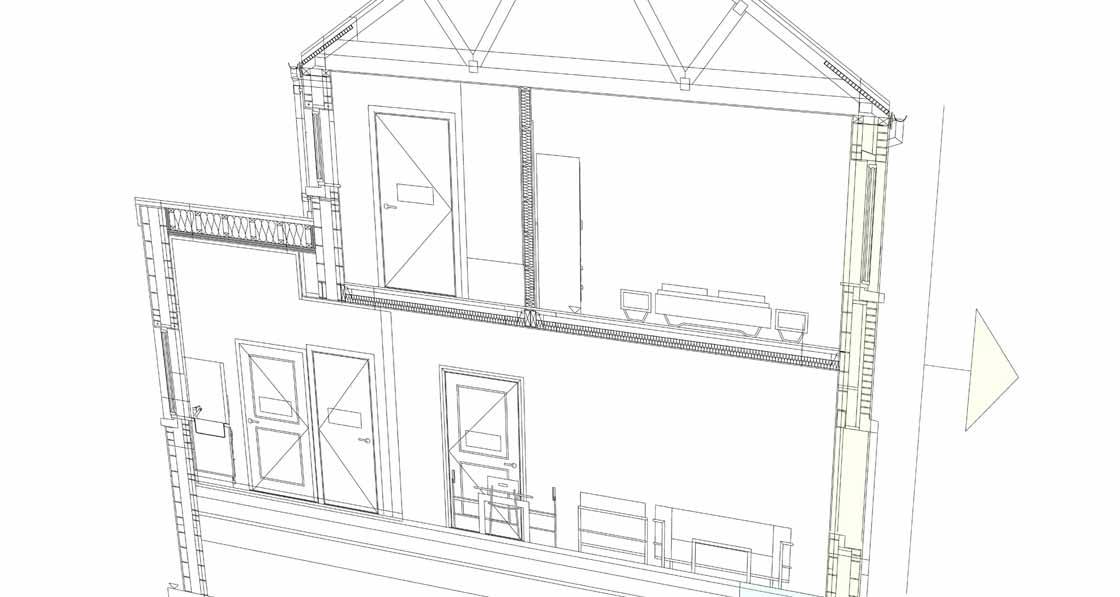
embodied carbon emissions of a 76 m2 end of terrace house provided by Cork City Council. The building was modelled in Sketchup by AECB chief executive Andy Simmonds, with the calculations carried out by PHribbon creator Tim Martel, working in collaboration with the author, and fellow PHAI board member John Morehead.
The house was designed to meet compliance with Ireland’s nearly zero energy building (NZEB) standard, including the following energy performance specifications:
U-values W/m2K
Walls: 0.145 – 1.64
Roof: 0.105 – 0.134
Floor: 0.101 – 0.137
Windows: 1.15
Doors: 1.1
Y-factor: 0.06
Mechanical extract ventilation
Airtightness: 3 m3/hr/m2 at 50 Pa.
Heating system: 6 kW air-to-water heat pump
Wain Morehead Architects prepared DEAP calculations to demonstrate that the specification complied with Ireland’s NZEB requirement for dwellings.
Building LCA modules: a brief explanation
With embodied carbon assessment generally there are certain areas where it’s possible to reach relatively clear conclusions with high degrees of confidence, while other aspects of the calculation may be more speculative. Life cycle assessment is divided into four modules: A, B, C and D.
Module A deals with the building construction up to the point of practical completion. This is the area where there is most scope for accurate embodied carbon calculation, for the simple reason that it involves assessing the impact of works that have been done. Module B deals with the use phase, including maintenance, repair, replacement and refurbishment. (It can also include operational energy use, but this is reported separately in the RIBA 2030 Climate Challenge, and in this analysis). It therefore involves making predictions about how the building will be operated, and about how long certain components may last. This can be affected by the quality of component, or by the quality of the design and construction, and also by occupant behaviour. For instance, if a building design hasn’t adequately considered surface or interstitial condensation risk, this may result in mould growth and potential for redecorating, repair to building fabric and in catastrophic cases, reducing the lifespan of the building. This can be exacerbated with occupant behaviour – especially where occupants are underheating or under ventilating buildings, hanging clothes indoors to dry, or placing furniture against external walls.
Module C deals with the end of life of the building. In line with the RICS methodology, this analysis assumes a 60 year lifespan. In reality, it is to be hoped that the lifespan is far longer. The historic replacement rate of housing stock in the UK is 0.5 per cent per annum, indicating that a 200 year lifespan should be possible for the main elements of a building. At the building’s assumed end of life, CO2 emissions associated with deconstruction/ demolition are added. Emissions locked up in timber and timber-based products are assumed to be released at this point. The default assumption is that 75 per cent of timber is incinerated, and therefore the CO2 is released, with 25 per cent being landfilled, and breaking down as methane, which has a considerably higher global warming potential than CO2, and actually increases the CO2 equivalent (CO2e) figure more than incineration would. Even if it’s assumed that the timber is in fact reused or recycled instead, the sequestered CO2 moves outside of the boundary conditions of the life cycle assessment.
The benefit passes on to the next use – meaning the LCA effectively regards it as being released into the atmosphere anyway. Module D deals with the potential for reuse, recovery and recycling, beyond the boundaries of the LCA. These figures can’t be included in the cradle to grave figures, so we’ve elected not to include them in this analysis. A particular focus on Module A is illustrative. A1 to A3 relates to the upfront emissions in manufacturing the materials – everything emitted up to the factory gate. A4 relates to transporting those materials from the factory gate to the site, and A5 relates to the construction process itself.
The data available presently tends to be clearest with regard to module A1-A3, as a growing number of manufacturers have already obtained Environmental Product Declarations (EPDs) or a French equivalent, the Product Environmental Passport (PEP), both of which include independently audited embodied carbon values for given products. There are also generic EPDs organised by industry bodies, which are intended to provide typical results for a given product type. These are less accurate than EPDs for specific products, for the very obvious reason that they don’t relate to a specific product. The vast bulk of EPDs tend to exist for building fabric products. Manufacturers of mechanical, electrical and plumbing products have tended to be less likely to obtain EPDs, though some relevant data is now available via the PEP database (www.pep-ecopassport.org).
This analysis focuses on the materials in the building fabric: the substructure (including insulation, cement-based screed and hardwood flooring), the external walls, windows and doors, internal walls and intermediate floors, the roof, and internal finishes to a builder’s finish. The heat pump is included, but there is no allowance for plumbing and heating distribution systems, electrics and lighting, the ventilation system, sanitaryware, bathroom and kitchen fitout, staircase, or for furniture, fixtures and equipment generally. Similarly, with the fabric, some information has been omitted in certain cases: such as wind posts and cavity closers. We have elected not to name proprietary products in general, although where possible, values were taken from actual EPDs for proprietary products.
It is relatively tricky to obtain accurate data on transport to site (A4). PHribbon includes default assumptions on transport based on UK government data on freight emissions, with different estimates per tonne km for sea freight, national road freight and local road freight. Based on the RICS methodology, PHribbon includes default transport distances of 300 km for national freight on an articulated lorry, and 50 km local freight on a smaller rigid lorry. In some instances, estimates have been made based on likely actual distances, but in practical terms this was often too much of an undertaking for this analysis. For instance, take the case of concrete foundations. While there are concrete product manufacturers relatively local to the site of the project in this analysis, not all of the ingredients would have been sourced at or near the factory. Also, while return journeys may not be an issue with national or international travel – in many cases articulated lorries delivering materials to a local depot would be taking other goods on return journeys – this is much less likely with smaller rigid lorries, meaning a 50 km local freight assumption may be an underestimate. In line with the RICS methodology, the default data for emissions related to the construction process (A5) is based on the economic value of the project.
The analysis includes certain elements which remained common in all cases: the roof and ceiling build up, internal walls and intermediate floor, windows, concrete sills and lintel, and heat pump. The only areas where variations were assessed included the external walls and the ground floor spec, including foundations.
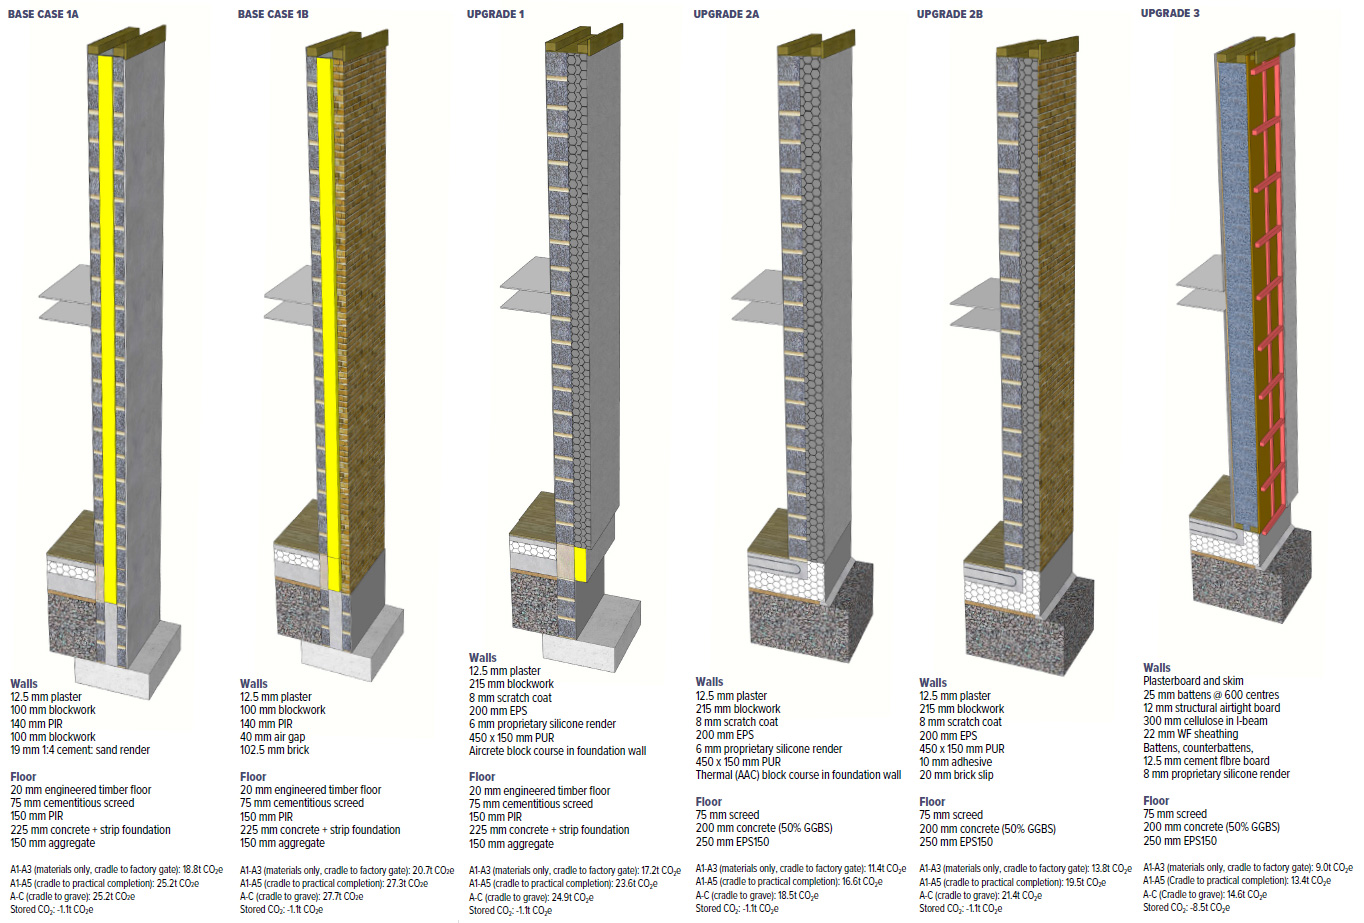
A health warning is necessary on the concrete figures. Data for the foundations in the base case was sourced from an EPD for a CEM I-based concrete – where 95 per cent or more of the cement is clinker (the active ingredient in cement). A lower embodied footprint would have been achieved by using CEM II – which has become the default product for most concrete applications in Ireland, excluding precast concrete. However, CEM II cement has a broad bandwidth – comprising from 65 per cent up to 95 per cent cement clinker, with different options for additions such as GGBS, fly ash or limestone – meaning it’s unclear how much of a reduction compared to CEM I that CEM II will achieve, unless the cement manufacturer has declared the amount and type of additives used in the CEM II cement. The figures for concrete blocks are derived from an industry association EPD, which doesn’t specify the type of cement used – meaning it’s not possible to reach conclusions on its constitution. The analysis established two base cases, Base Case 1A and 1B, derived from what was considered to be a typical Irish reference: a cavity wall building with strip foundations, with both the floor and cavities insulated with oil-based insulation board. The only difference between the two was the outer leaf: rendered blockwork in the case of Base Case 1A, and a brick outer leaf for Base Case 1B.
The best performing option is Upgrade 3, the timber frame build on insulated foundations, which comes in at 9 tonnes of CO2e.
Upgrade 1 includes one change: instead of cavity walls, it includes a single leaf 215 mm block-on-flat fitted with oil-based external wall insulation (EWI) and a silicone-based render system. Upgrade 2A and 2B include EWI with render and brick slips respectively, and in both cases substitute the strip foundation for an insulated raft foundation system, including 50 per cent substitution of ordinary Portland cement (OPC) with GGBS. Upgrade 3 retains the same insulated foundations spec, but switches to a cellulose-insulated timber frame wall, finished with a rendered cement board system.
Material impacts: walls and floors
It is worth first considering the embodied carbon emissions of materials by the time they leave the factory gate, given that it’s possible to pin down these figures with greater certainty, and to focus first on the areas where variations were considered: external walls and foundations. The worst performing option in this case is Base Case 1B, the brick-clad cavity wall build, which comes in at 20.1 tonnes of carbon dioxide equivalent (CO2e), a measurement used to compare emissions of all greenhouse gases based on how their warming impact relates to that of carbon dioxide.
Simply switching from brick to a rendered block outer leaf (Base Case 1A) drops the total to 18.2 tonnes. Switching to single leaf 215 mm blockwork with rendered external insulation as per Upgrade 1 drops the total to 15.4 tonnes. A further significant drop to 11.4 tonnes is achieved in Upgrade 2A by switching from conventional foundations to an insulated foundation system with 50 per cent GGBS. Upgrade 2B sees the total rise again to 13.8 tonnes, due to switching from a rendered finish to brick slips. The best performing option is Upgrade 3, the timber frame build on insulated foundations, which comes in at 9 tonnes of CO2e.
Sequestered CO2
It’s important to treat the sequestered CO2 figures with care. After all, timber-based construction products don’t suck CO2 out of the air – forests do. The notion of achieving carbon negativity by using vast quantities of timber may be too simplistic. But notwithstanding issues around the need for broader attention to sustainability in forestry management, a strong environmental case can be made for lean timber-based approaches, such as those that make structural use of Larsen trusses or I-beams.
Upgrade 3 in this analysis therefore opted for just such an approach. In terms of the wall and floor analysis, the sequestered CO2 in the timber and timber-based products used, including cellulose insulation – is almost equivalent to the entire A1-A3 emissions for the wall and floor. However, this is not to suggest that one figure should be netted off against the other. While there is a value in keeping CO2 sequestered in buildings – hopefully for centuries – perhaps the more significant point is that by stage A1-A3, the timber frame and insulated foundation option in this analysis had emitted less than 40 per cent of the emissions of the brick-clad base case.
This is not down to the timber frame alone, but to the application of a combination of carbon saving yet mainstream materials: cellulose insulation, GGBS, cement board, silicone render and a foundation approach that reduces the amount of concrete used. There is also some sequestration assumed via carbonation of concrete in the case of the blockwork – included because sequestration figures were included in the EPD for concrete blocks.
Transport and construction emissions
When transport and construction emissions are considered, the differences between the different build approaches look a little less pronounced, because construction emissions – estimated based on the value of the project, which is assumed not to have changed – are identical in each scenario, at 1.2 tonnes for the walls and ground floor. As mentioned before, the transport data is much less precise than the materials data, given the use of default values in this case. Interestingly, in spite of the fact that many of the materials in the timber frame option are estimated to have travelled far greater distances – such as the cement board, wood fibre sheathing and silicone render – its transport emissions total remains far lower than the base cases – 3.2 tonnes compared to 5.9 tonnes for Base Case 1A and 6.2 tonnes for Base Case 1B. This is for a few reasons: the carbon factors for rigid HGVs assumed locally are far higher than large artics assumed for larger distances, sea freight emissions are very low in relative terms, and heavy materials add considerably to the transport emissions.
Use stage
In the use stage (Module B), the analysis generally assumed that the building fabric measures would last for the 60 year lifespan of the building set out in the RICS methodology. This rationale is supported by the existence of 60 year design life statements in Agrément certificates for proprietary systems in the case of cement fibre boards and external insulation systems. In the case of the building’s double glazed windows, a 40 year lifespan has been assumed, meaning one replacement is included in module B. Base Case 1A was assumed to have a standard sand/cement 19 mm render, with an estimated 30 year lifespan. The main contribution in the use stage is the air source heat pump. Data for the 6 kW heat pump was derived from an industry association Product Environmental Passport, representing a number of mainstream brands. The PEP assumed a 17 year lifespan for the heat pump, which therefore meant three replacements within the sixty year timeframe, and an embodied carbon total of 8.8 tonnes. The analysis assumed that while the first heat pump would have leakage (in line with CIBSE TM 65) of conventional refrigerants with a high global warming potential, policy on phasing out polluting refrigerants would have kicked in after this point, meaning CO2e emissions for refrigerants were not included in replacement units.
There is a remarkable point of comparison here: the cradle to factory (A1-A3) and use stage (B) emissions for the heat pump come in at 8.7 tonnes, compared to 9 tonnes for the external walls and floors of Upgrade 3, the timber frame variant. Heat pumps have an important role to play in decarbonising heating, but – while embodied carbon data on MEP systems generally is in its infancy, clearly work is needed to reduce the embodied carbon of building services. In part this may be down to assuming longer lifespans, and therefore fewer replacements – and there is some evidence of air source heat pumps lasting far longer than 17 years. Another factor which may make a substantial difference is reducing the demand and size of a heat pump, provided it can comfortably meet the building’s actual heat load.
The roof build up was common to all variants, consisting of a standard trussed roof with cement fibre slates, and mineral wool insulation at ceiling level. Internal walls consisted of a timber stud walls insu lated with mineral wool and finished with plasterboard, and the intermediate floor included a metal web joist, mineral wool insulation, plasterboard beneath and chipboard above.
The constant elements – roof, internal walls and intermediate floor, windows and heat pump – add 6.9 tonnes to the module A emissions, 15.3 tonnes to the cradle to grave (A-C) total, and sequester 5.4 tonnes. Further reductions could have been made from the constant elements by a number of measures such as reductions in the number of replacements of heat pumps, choosing a window spec where 60-year lifespan may be reasonably assumed, switching to cellulose insulation for the roof and switching to a thinner calcium sulphate screed. If more radical changes were considered – such as using cellulose insulation in the floor and using ground screws instead of concrete foundations – additional significant reductions could have been achieved. There is also an interesting question of whether improving the fabric to the passive house standard – utilising low carbon materials – would have achieved further reductions, by enabling the use of a smaller heat pump and reducing or potentially removing the need for underfloor heating or other heating emitters. It’s important to note that this analysis was not attempting to produce a like for like comparison between typical cavity wall builds and other approaches. Rather the emphasis was on taking a base case where there has been no particular focus made to reduce embodied carbon use, and to explore what kinds of reductions could be made by switching to relatively mainstream alternatives, supported by certification attesting to their longevity and fitness for use. Further analysis may also involve consideration of other build systems such as insulating concrete formwork, light gauge steel frame, mass timber, poroton blocks, and less mainstream approaches such as hempcrete and strawbale construction.
Notwithstanding the health warnings over some of the limitations in this analysis, it demonstrates some of the significant differences in embodied carbon that can result from changes in build specifications at design stage.
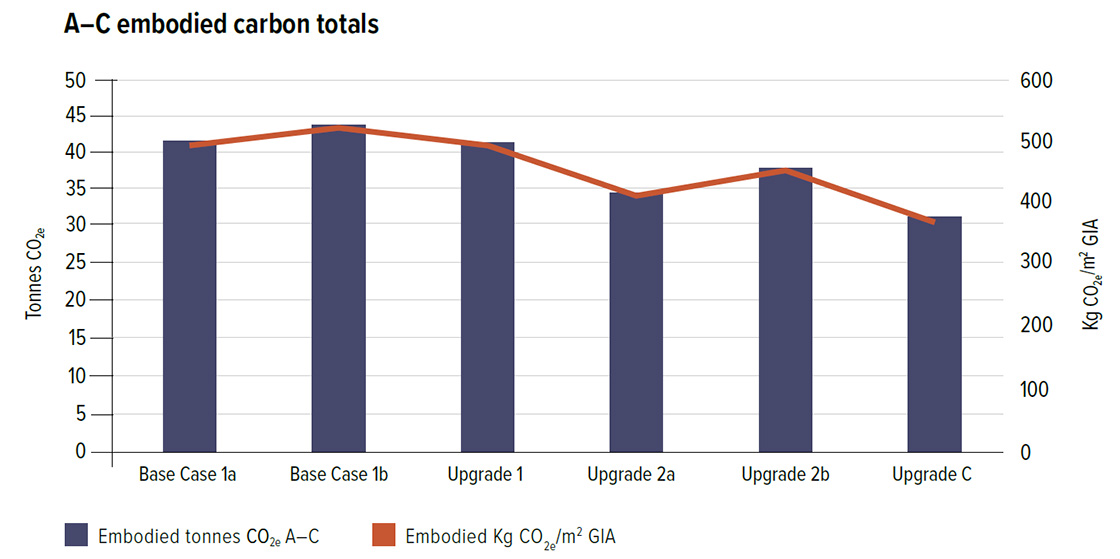
Whole building cradle to grave emissions
The differences between the various build methods look less pronounced when the whole building calculations are included, rather than the walls and floors only, because the constant elements add significant amounts to the totals. The worst performer, Base Case 1B, totals 43.9 tonnes of CO2e, while the best performer, Upgrade 3, totals 30.8 tonnes.
It’s useful to compare the six variants against the embodied carbon targets in RIBA’s revised 2030 Climate Challenge, albeit with the major caveat that not all of the elements of the building have been included in this analysis.
The worst performer, Base Case 1B, totals 526 kg CO2e/m2 gross internal area (GIA). In the author’s view, having consulted with building LCA experts, this means it may meet the 2030 target for residential/domestic buildings of 625 kg CO2e/m2, once the missing elements are included. The best performer, Upgrade 3, comes in at 369 kg CO2e/m2, indicating it would likely comfortably surpass the 2030 target. The author speculates that Base Case 1A and Upgrade 1, which respectively total 496 and 492 kg CO2e/m2, would also comfortably meet the target, once the missing elements are included. This begs the question: if a notional house built with business-asusual build specs can potentially meet a forward- reaching embodied carbon target, does the target need tightening?
With thanks to the Passive House Association of Ireland for commissioning this analysis, to Andy Simmonds and Tim Martel of the AECB for conducting the analysis in collaboration with the author and John Morehead, and to Cork City Council’s architect’s department for providing a house type to analyse. Thanks are also due to industry sources who fielded awkward technical questions, including Jane Anderson of Construction LCA, Jess Hrivnak of RIBA, Peter Seymour of EPD consultants EcoReview, Simon Sturgis of Targeting Zero LLP and numerous others.