

- Design Approaches
- Posted
Mixing It Up

As Building Regulations tighten on carbon emissions, energy reduction and mandatory renewable energy targets, the task for designers becomes harder and harder. Bobby Gilbert of Bobby Gilbert and Associates explains how a new design tool is making sustainable design easier.The process of calculating CO2 emissions for a development is one of first calculating energy demands (different buildings have different energy demands for heating, cooling, hot water, and power for electrical appliances), then selecting energy supply systems and calculating how much fuel these supply systems will use. It is the burning of fuel, directly or indirectly – such as at a power station to produce electricity – that results in CO2 emissions, with different fuels producing different quantities.
Whilst this process is not rocket science it requires a methodical approach if it is not to result in confusion. Consider a mixed use development with a range of building types each of which have different energy demands. The energy supply strategy could be based around a number of systems including solar hot water, photovoltaic power, ground source heat pumps, combined heat and power, and so on, as well as conventional gas boilers and grid sourced electricity. These systems will have varying efficiencies which, combined with the type of fuel they use, will result in a wide variety of levels of CO2 emissions. Now add in costs for the various components (both capital and running costs) as well as the cost of fuel and perhaps even the polluting cost of the CO2 emissions. The calculation of emissions and costs starts to become more complicated, though not insurmountable if you keep a cool head.
The complications really start with the “what if?” studies. What if we use ground source heat pumps instead of gas boilers? What if we put wind turbines on the site instead of photovoltaic panels? What if the price of fuel doubles in the next 10 years? These sorts of questions and many others should be asked right at the very start of a design process. The trouble is keeping track of all the assumptions you make when doing the different calculations, so that when asked what made option A better than option B in 12 months time you can give a clear and confident answer rather than have to wade through a mass of confusing spreadsheets.
Carbon Mixer is designed to make this process consistent, reliable and robust. It stores the characteristics of buildings, heating, cooling, power, and renewable systems in a database from which it is easy to mix and match combinations and find CO2 emissions and costs. Any interesting scenarios can be saved in a project file which can be archived with other project data, or emailed to a colleague for discussion, and at any time in the future can be easily reproduced. The strong use of graphics during the data input stage means that users can see instantly how a mix is working and where strengths and weaknesses lie. This aspect is particularly useful in discussions with clients and other professionals who can instantly see the impact of a proposed change to the energy strategy.

Carbon Mixer
Carbon Mixer is used by architects, developers, energy consultants, and local authorities in order to have a clear and transparent language for energy strategies. It is the recommended tool by the 21 local authorities forming the North East Assembly in the UK.
The following is an example in Ireland using the Malahide Road project by Joseph Little Architects . This project is described in detail in a separate article (ed. – See In Transit ).
First it is necessary to get an estimate of the building energy demands. Carbon Mixer comes with estimates for typical “building regulation” houses and “low energy” houses however if possible a more accurate estimate of energy demand should be used. This could be from fuel bills for an existing building or from a simulation of demands in a building at the design stage. Ireland has just introduced the DEAP assessment process which is now required for all domestic buildings and this is a good place to get an initial estimate of the likely building demands.
The DEAP assessment of Malahide Road gave an annual space heating requirement estimate of 8006 kWh. Note that this is the heating demand, not the amount of gas or other fuel required which will generally be higher as boilers are less than 100% efficient. The fuel use will be calculated by Carbon Mixer.
The hot water heating requirement was 4049 kWh. Some of this requirement was assumed to be met by solar hot water in the DEAP assessment; it is important to include all of the demand even if it has nominally been split. This is so that Carbon Mixer can be used to consider other scenarios which may have different amounts of solar hot water provision.

Electrical appliance requirement from DEAP was 1847 kWh. DEAP currently only considers electrical energy required for lighting and for heating system pumps and fans as this is all that is required by current Irish building regulations. If a truly zero carbon home was being designed it would be necessary to also include an estimate for electrical use of other appliances in the home, such as washing machines, TVs, cookers and computers. One source of an estimate for the demand of these items is the UK code for sustainable homes which requires all demands to be included before calculating the base CO2 emissions. Strangely this is only done at the highest level (level 6) of the code. Other levels don’t include additional appliances when making comparisons. This is a source of much confusion in the UK which hopefully won’t be repeated in Ireland.
For the purposes of this example the DEAP values described above were loaded into Carbon Mixer together with the floor area of the building (187m2). In addition DEAP gives demands for a building equivalent to your design built to the minimum standards which wouldn’t actually pass building regulations but is used as a comparison. This comparator building was also loaded into Carbon Mixer. The screenshot above shows how energy systems could be mixed and matched to get an instant feel for their effectiveness when compared with the DEAP starting point. Any interesting scenarios were saved for comparison and future reference.
A number of scenarios were saved for comparison. The CO2 emissions for each case is shown in the comparison chart below:

First the Joseph Little Architects improved building fabric design was compared with the DEAP base case. This showed a 21% reduction in CO2 emissions due to better insulation, better air-tightness and a state of the art gas boiler. Now, having reduced demand as much as possible, further reductions with renewable technologies were investigated. The 4m2 of solar hot water collector produced a further 10% reduction. 3 scenarios were then considered each of which gave approximately 100% reduction in CO2 emissions compared to the DEAP base case. These were:
Option 1
Solar hot water system (SHW) + 50m2 of photovoltaic panels (PV)
Option 2
SHW + biomass wood pellet boiler + 18m2 of PV
Option 3
SHW + biomass + micro wind turbine + 7m2 of PV
The CO2 comparison chart shows that option 1 achieved 100% reduction by exporting a lot of electricity to the grid to offset the emissions from the gas boiler. In the next option the gas boiler was replaced with a wood pellet boiler which has very low CO2 emissions and so less export of electricity is required. This option is shown in more detail in the thumbnail charts below which compare the energy strategy with the base case. The energy demands are shown below the zero line with the matching energy supply systems are shown above zero line. The excess PV production in summer is exported to the grid and shows as negative emissions on the CO2 chart which offset the small amount of CO2 emissions in the winter.
In the final option a micro wind turbine reduces the need for photovoltaic panels. Note that wind turbines will only be effective if there is plenty of wind! In urban environments the wind is generally low speed and/or turbulent and not useful for a micro wind turbine. The example shown in Carbon Mixer is based on the availability of wind with a yearly average speed of 4.5m/s. It would be necessary to assess the site to see if this is realistic.
So, assuming there is wind for the wind turbine and sufficient south facing roof space to mount the solar panels, which is the best option? The capital expenditure output (see below) shows the last two of the three 100% reductions to be the cheapest (costs were not available for the improved building design so this is shown as zero capital expenditure increase).

Capital expenditure output
However if we consider return on our investment by looking at the effect of the renewable systems on our annual costs we see that the SHW + PV option has the cheapest running cost.

Annual Costs
The running cost includes cost of fuel, cost of maintenance and service and optionally the cost of CO2 pollution which can be a real cost or a notional cost to society.

Years to Payback
By comparing the capital expenditure with the annual costs/savings we can choose a system based on best payback. Of the three 100% reduction options the first two appear to be the best.
This picture could change for example if the high service costs shown for the pellet boiler and the wind turbine options could be reduced (for instance by DIY maintenance). Also different assumptions of the rate at which fuel prices will rise in the next few years can have a significant impact. These factors can be added to the Carbon Mixer database to see the impact.
The example above is for a single dwelling. Carbon Mixer is often used for mixed use developments. For example a quick feel for low carbon strategies for a development comprising domestic, offices, retail, schools, leisure and so on can be obtained in a matter of minutes using the supplied benchmarks if the approximate floor areas of each of these building types are known. Do you need 100m2 of photovolataic panels or 10,000m2? Once an outline strategy has been found the accuracy can be improved by inputting more details into the database.
Carbon Mixer – coming soon…
The already large database of benchmark building types supplied with Carbon Mixer is being further extended to cover more types allowing quick and easy outline assessment of mixed use developments.
DEAP (EIRE) and SAP (UK) pre-assessment procedures are being designed which will allow you to analyse the buildings you are putting into Carbon Mixer with the same instant feedback as for the energy strategy. Where is your building letting you down: insulation, draught-proofing, cold-bridging? With Carbon Mixer you will instantly see the proportionate heat loss. Further improvements to the reporting system will allow a full analysis of your energy strategy to be output straight to a word document ready for you to edit and add your own descriptive paragraphs.
Carbon Mixer – more details
Carbon Mixer is free to download and use for an evaluation period. Full licences can be purchased from Bobby Gilbert and Associates Ltd. To find out more about Carbon Mixer go to: www.carbonmixer.com
or contact This email address is being protected from spambots. You need JavaScript enabled to view it.
Related items
-
 Experts call for CO2 sensors as tool in Covid fight
 -
 Steeply sustainable - Low carbon passive design wonder on impossible Cork site
 -
 Focus on whole build systems, not products - NBT
 -
 International - Issue 29
 -
 Passive Wexford bungalow with a hint of the exotic
 -
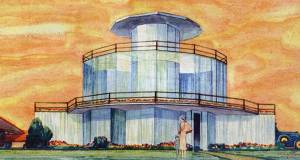 The House of Tomorrow, 1933
 -
 1948: The Dover Sun House
 -
 The dazzling Dalkey home with a hidden agenda
 -
 Mayo passive house makes you forget the weather
 -
 A1 passive house overcomes tight Cork City site
 -
 Norfolk straw-bale cottage aims for passive
 -
 Time to move beyond the architecture of the oil age