

- Renewable Energy
- Posted
New homes data reveals extent of Irish low energy revolution
Ireland’s new build housing market is undergoing a radical transformation in energy performance specifications, analysis by Passive House Plus has revealed — with oil heating all but vanishing from use, leaving gas boilers and heat pumps to dominate the heating market.
This article was originally published in issue 22 of Passive House Plus magazine. Want immediate access to all back issues and exclusive extra content? Click here to subscribe for as little as €10, or click here to receive the next issue free of charge
Meanwhile insulation standards are approaching passive house levels, average airtightness results are roughly three times tighter than during the boom, and both solar photovoltaic arrays and whole house mechanical ventilation systems are being installed in the majority of new homes for the first time. The analysis also contains revealing information on a broad range of indicators including dwelling type, location and completion numbers.
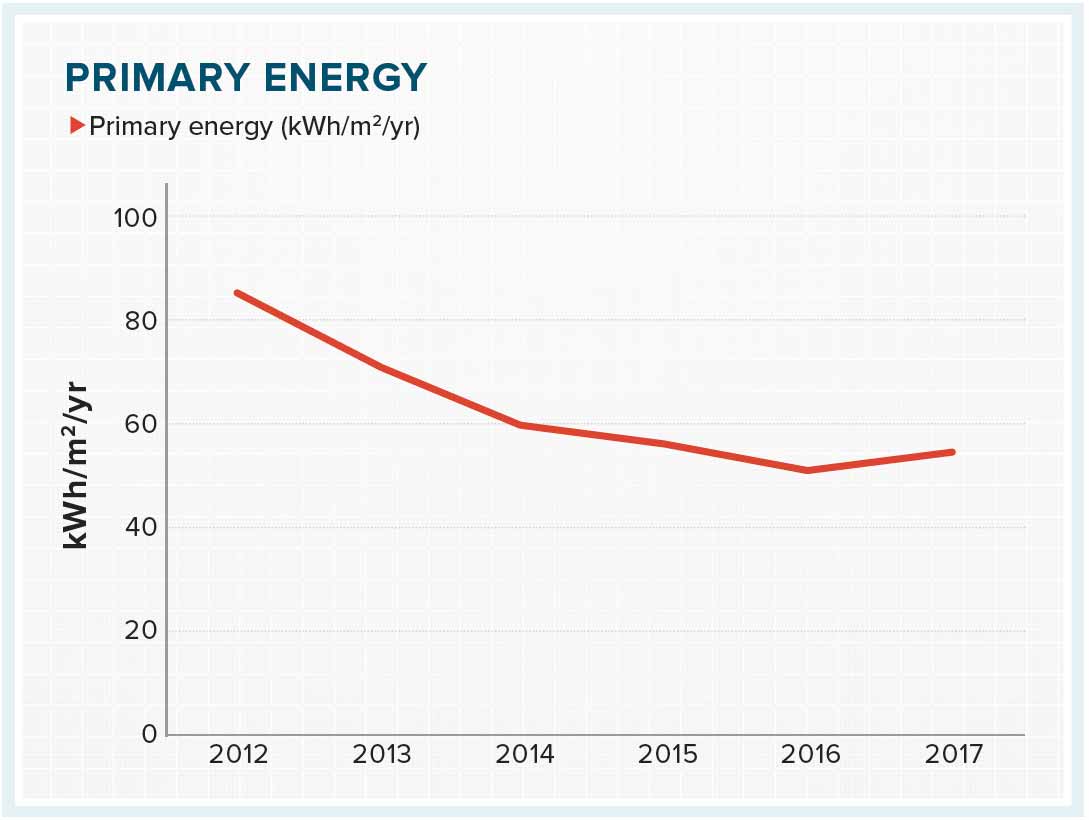
Taking account of final and provisional BERs for new homes subject to the current version of Part L, the average new home last year achieved a primary energy score of 54.2 kWh/m2/yr, meaning standard practice in the industry is on the cusp of an A2 BER. This indicates that the industry is well placed to comply with the forthcoming nearly zero energy building standard, which the Department of Housing estimates will bring the average home up to 45 kWh/m2/yr. According to the department, the average new home built to the current building regulations has a primary energy target of roughly 60 kWh/m2/yr, which suggests that the industry is typically exceeding minimum compliance by some distance.
It’s not possible to determine exact compliance levels with the headline targets in Part L — 60% energy and carbon reduction targets for each dwelling compared to 2005 regulations, expressed as energy performance and carbon performance coefficients — as SEAI did not include this data in the database.
But 99.2% of final and provisional BERs for new homes scored an A3 BER or better in 2016, a figure that was exactly replicated for the first half of 2017. However, there are signs of a possible decline in ambition, given that the number of A3 ratings among new homes rose from 70.8% last year to 77.77% in 2017, with A2s falling from 28.1% to 21%.
In spite of the average new home appearing to comfortably exceed building regulations requirements, A1s remain a rarity. Just 0.26% of BERs for the total number of new homes subject to the current version of Part L topped the scale. To put that in perspective, six of the thirteen A1 rated homes built in 2016 are featured in this issue of Passive House Plus, while all bar one of the others have featured in previous issues.
Provisional BERs indicate intentions rather than actions, and there is evidence of a very small weakening from provisional to final BERs. While 99.2% of BERs this year and last year scored an A3 or better, 99.05% of final BERs for new homes built last year achieved an A3 BER or better, with a slight decline to 98.46% in 2017 so far.
The analysis, which is based on detailed information contained in SEAI’s National BER Research Tool, draws from the sum total of final and provisional BERs for new homes published up till 3 July. Final BERs are required for all new homes in Ireland — including, as a consequence of new laws introduced in 2013, self build projects, prior to occupancy.
Provisional BERs are required for all new homes being sold or rented off the plans. According to SEAI the data is not prone to duplication, as both provisional and final BERs are linked to a unique identifier, the electricity meter point reference number (MPRN). Once a building is completed and a final BER is generated, the provisional BER with the same number is automatically purged from the system.
House completions & house type
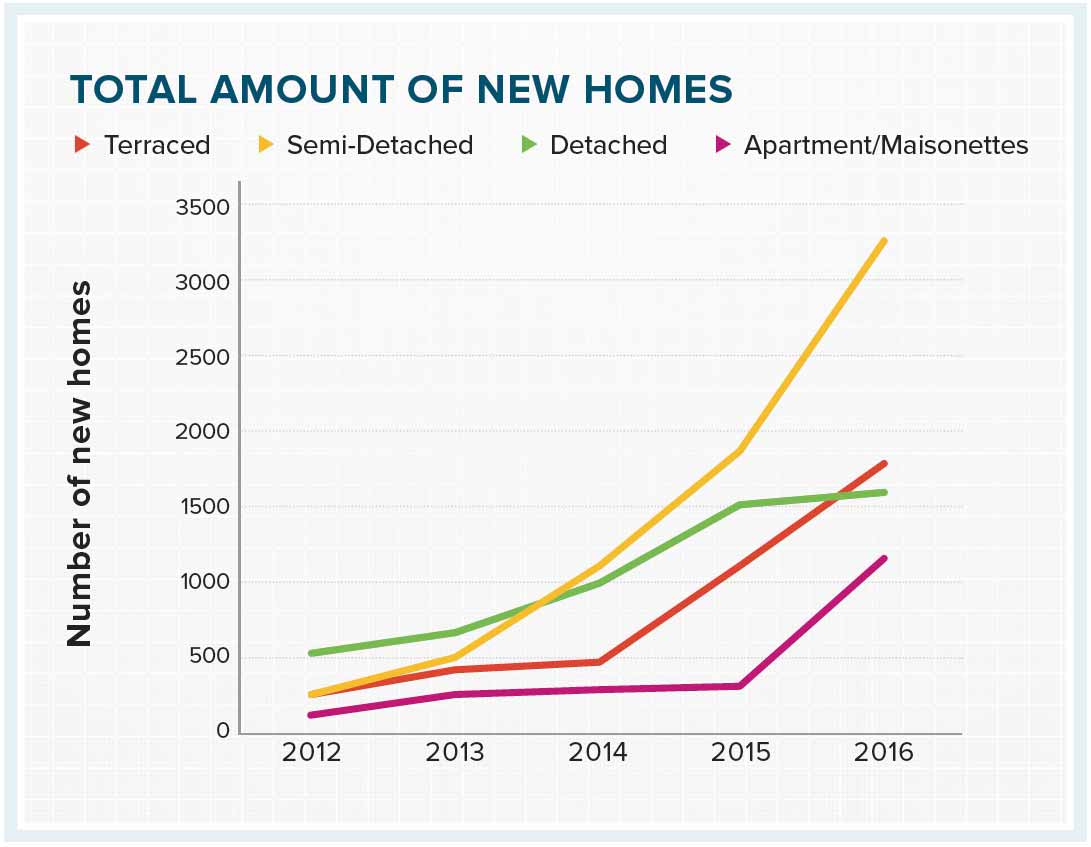
The total number of BERs for new homes subject to 2011 TGD L where 2016 is listed as the year of construction includes 5560 final BERs and 2,105 provisional BERs. This appears to indicate that the Department of Housing’s quoted statistics of 14,932 new house completions are inflated by a factor of almost three. Given the legal requirement to publish a final BER for all new homes, the only other explanation is that almost two-thirds of new homes are in breach of European law.
While overall completion rates remain extremely low, an analysis of final BERs for homes built to either 2011 or 2008 TGD L indicates a profound increase in terms of new house completions — rising from an implausibly low 803 in 2012 to 5,560 in 2016 — but this should not be solely attributed to the economic recovery. All new homes constructed post 2013 require a BER prior to occupancy. Prior to that point, self-builders had no obligation to obtain a BER. �
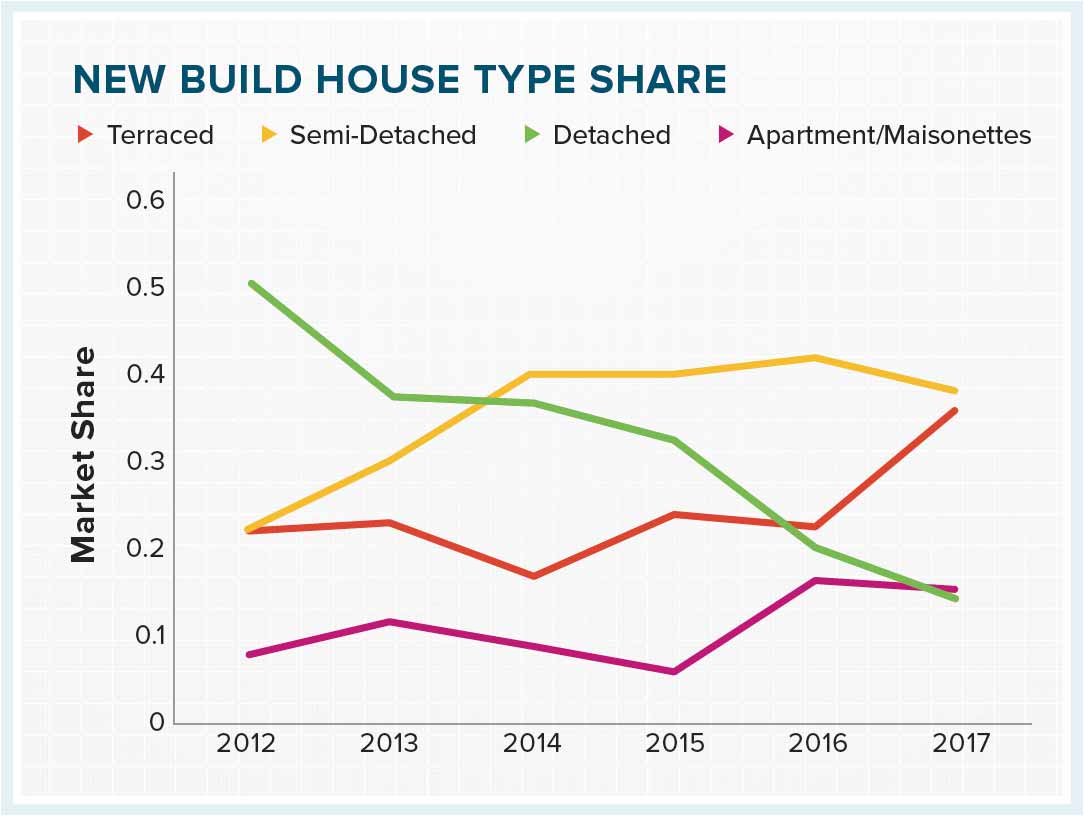
There is a marked shift in market share by house type, with detached houses dropping from first in 2012 – even before the new BER law kicked in – to last in 2017 so far, as developers return to building.
The average primary energy score of new homes has improved substantially since 2012 — dropping gradually from a far-from compliant 86 kWh/m2/yr in 2012 — a mid B1 rating — to a high water mark of 54.2 kWh/m2/yr last year, before increasing slightly this year to 54.9 kWh/m2/yr.
Meanwhile, calculated annual CO2 emissions have been falling year on year — reducing from 18.90 down to 10.69 KG/co2/m2/yr from 2012 to 2017.
In general, this analysis has focused on BERs for new homes built to the current version of Part L, which came into force in 2011 (the exception, where we have considered data relating to new homes built to 2008 regulations, has been to attempt to shed light on completions rates, house types, etc. ).
The figures for 2012 and 2013 are low, as buildings where a planning application had been made prior to 1 December 2011 could be built to the previous 2008 standards provided they were substantially complete by 1 December 2013. The database contained final BERs for 644 new homes built to 2008 TGD L in 2012, 1,005 in 2013, and 189, 131, 45 and 13 respectively from 2014 to 2017. Records for a given year are subject to change, depending on when SEAI’s database — which is updated daily — is downloaded, as BER assessors are able to add BERs for new homes constructed in previous years.
Main space heating
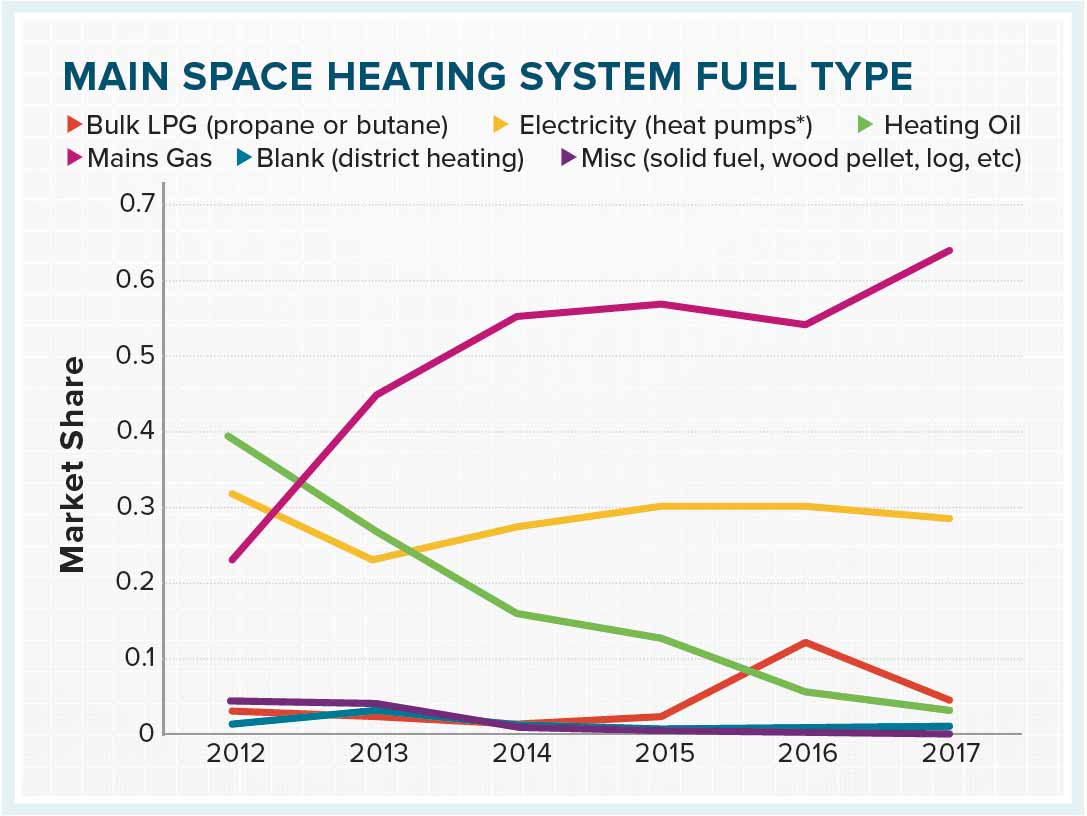
Oil heating has fallen almost entirely out of favour. Just 2.54% of BERs for new homes in the first half of 2017 include home heating oil as the main space heating fuel. Yet in 2012 — albeit with a small sample size, and at a time when detached homes were predominant — oil was the main heating fuel, specified in 39.7% of new homes. It’s decline has been exponential and severe. Oil fares better than its national average in 15 — all rural — counties, where it takes a much stronger average of 28.5% of the market so far in 2017. But this represents just 88 new homes, and even in these areas oil is playing second fiddle to heat pumps, at 46.42% of an admittedly small market.
Heat pumps have averaged 28% of the market since 2012, and have been remarkably stable in holding their market share in that time. Biomass and solid fuels are nowhere to be seen, and LPG fares little better. District or communal heating systems, typically connected to a gas fired combined heat and power plant, are down 6% on last year’s high of 10%, but this technology’s figures are prone to noise in the data given the low rate of construction. One or two large apartment schemes in the next few months could see these technologies maintain or even grow last year’s market share – and anecdotal feedback from suppliers is positive.
Mains gas has grown its position as the dominant heating fuel, up from 53.6% last year to 64% in 2017 so far. It’s the main heat source in 26 counties and Dublin postcodes, where it has picked up nearly 4000 homes.
Renewables
95.75% of new homes since 2012 have included at least one renewable energy system, with a further 3.46% connected to a combined heat and power (CHP) plant. While heat pumps are now a mainstream technology, the most dominant renewable energy system is solar PV, which has had a meteoric rise from just 4.2% of new homes in 2012 to topping 50% in 2015 and 2017, likely due to its popularity with developers as a low cost way of meeting the renewable energy target in Part L without shifting away from gas boilers. Meanwhile solar thermal has dropped from 61% of new homes in 2012 to 12.94% in 2017 so far.
Ventilation
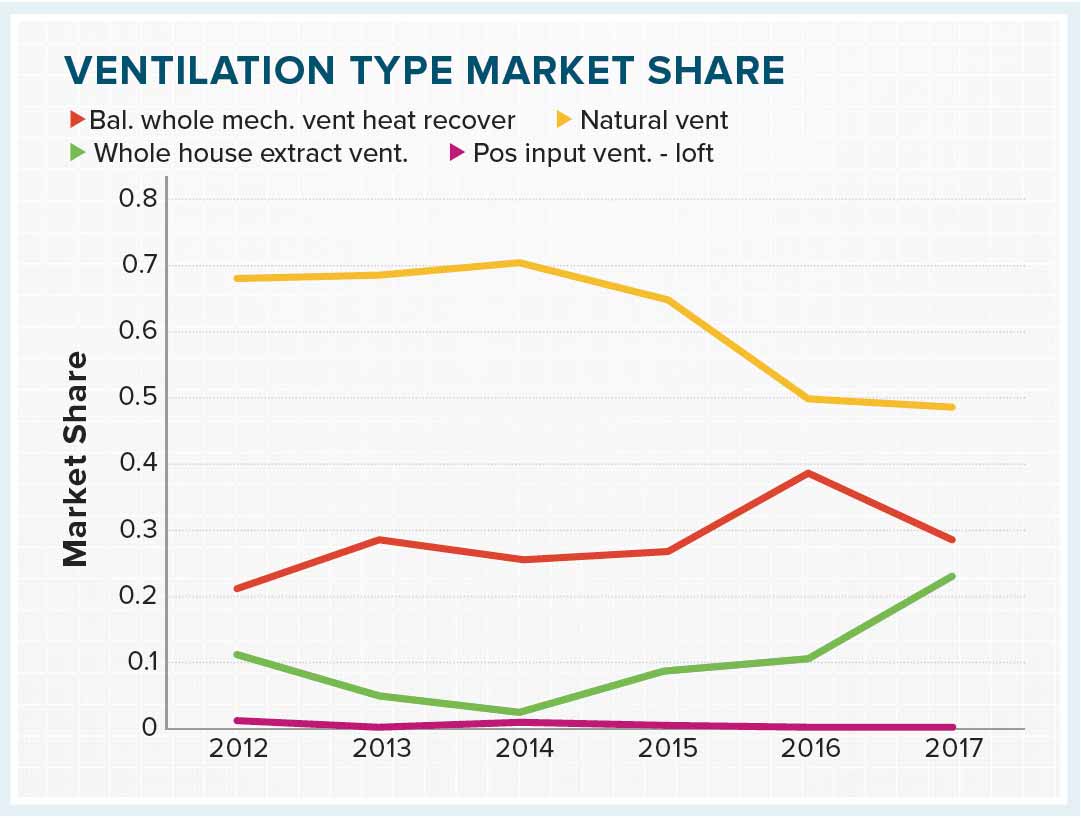
As awareness of the need for more reliable ventilation in low energy buildings grows, so-called ‘natural’ ventilation has lost its position as the default choice for dwellings, with whole house mechanical ventilation systems — either heat recovery ventilation or whole house extract ventilation, including demand controlled ventilation – being selected for a combined 50.9% of new homes. That’s in spite of heat recovery dropping from 38.5% last year to 28.07% this year so far, with whole house extract ventilation eating into its market.
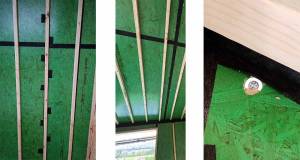
Airtightness
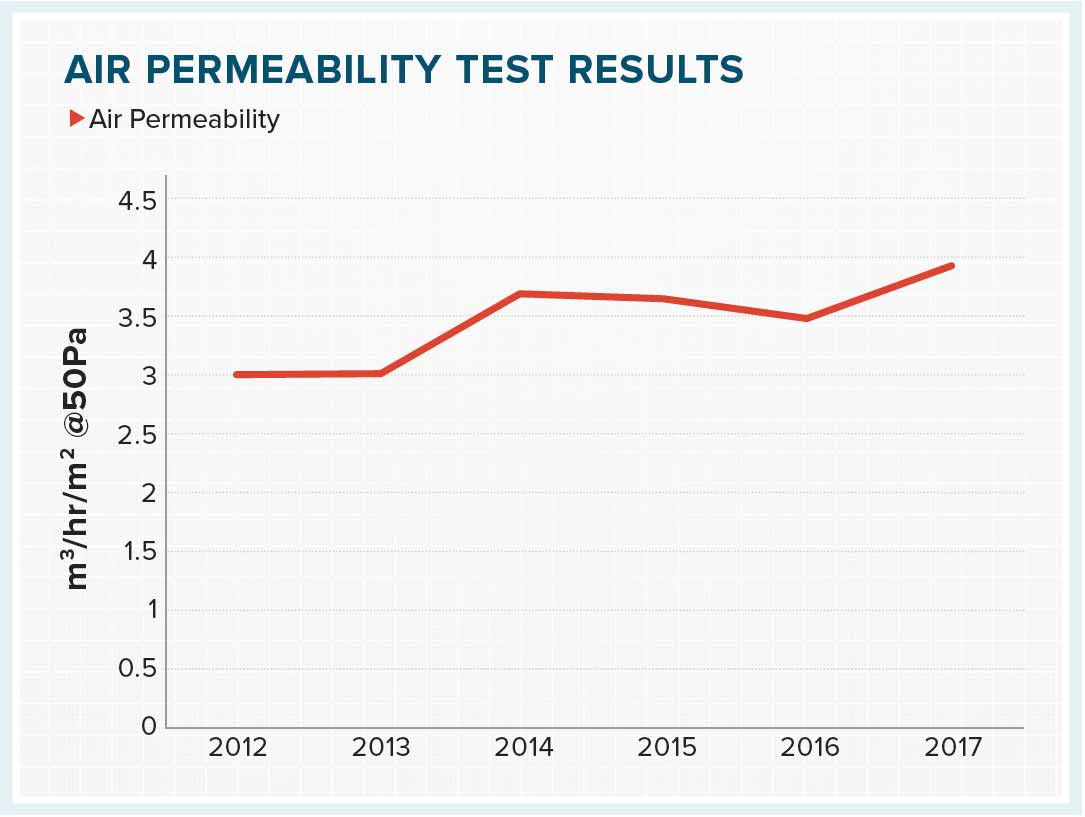
Alarmingly, given that airtightness tests serve as an objective construction quality indicator, average airtightness levels have declined from 2.97 to 3.85 m3/hr/m2 at 50 Pascals between 2012 and 2017. This still compares favourably to standards during the last construction boom, such as the average of 11.8m3/hr/ m2 recorded for homes built around the turn of the millennium as part of the Energy Performance Survey of Irish Housing. Without due care, further declines are highly likely as house building activity increases.
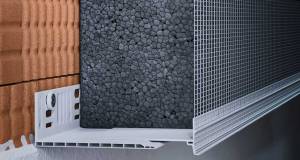
Thermal bridging
Analysis of the 2016 homes showed that a Y-value of 0.08 was used in 80.40% of cases — a value that is permitted for use when thermal bridging details used correspond to the Acceptable Construction Details. Meanwhile 6.94% used the punitive default of 0.15 — which is to be used when neither the ACDs or thermally modeled psi values have been used, while 12.67% inputted another value, indicating the use of details calculated by a thermal modeler. The average Y-value for this group came to 0.0478.
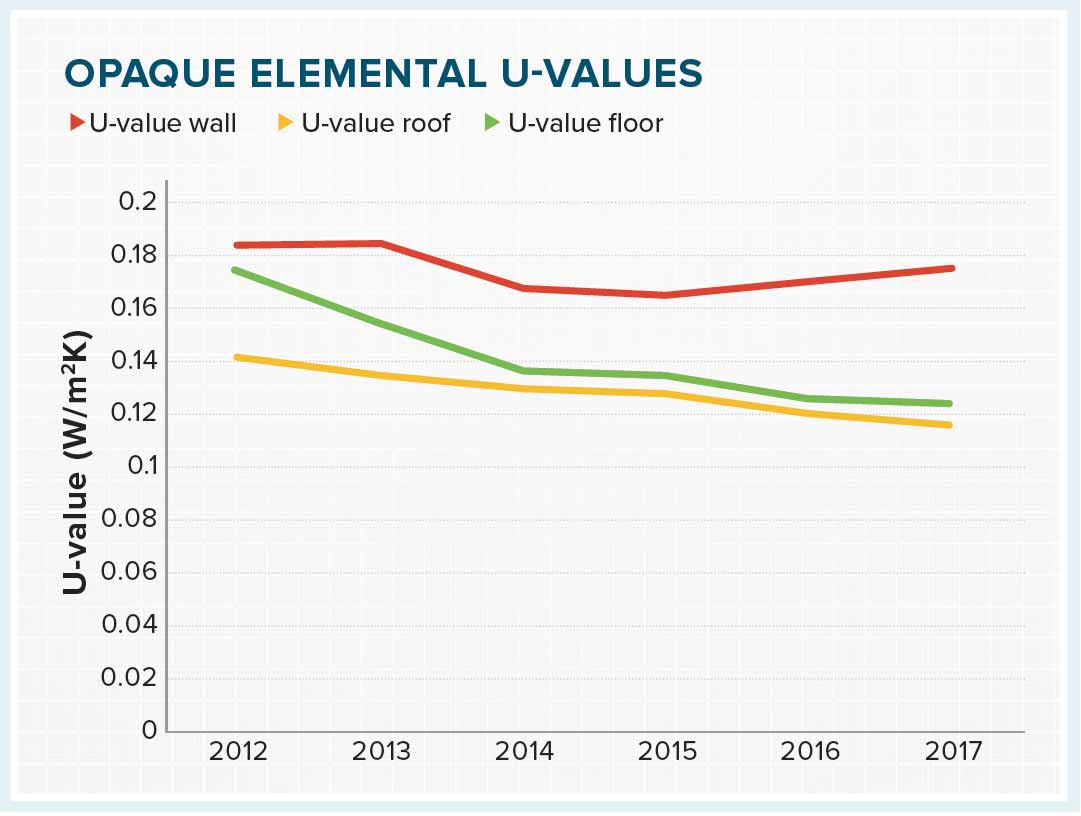
U-values
Average U-values for opaque elements are all within the upper limit of SEAI’s Irish passive house design guidance document, ‘Passive homes’. Walls have been stable at 0.17 since 2014, although weakening a little since 2015, while floors and roofs have both been continuing to improve, dropping to just 0.12 in each case.
Windows and doors by comparison still have some way to go. Windows have improved gradually from U-values of 1.42 in 2012 to 1.2 this year — to the cusp of triple glazed territory — while entrance doors have gone from 2.12 to 1.55.
Overall, the picture is of a profound improvement in energy performance standards for new homes, leaving aside concerns about performance gaps, overheating and the still-too-high prevalence of non-mechanical ventilation. But thanks to the foresight and openness of SEAI in deciding to share the raw data that enabled this analysis, we can create a remarkably detailed, current overview of the state of new build housing.
- Issue 22
- BER
- airtightness
- Uvalues
- building energy ratings
- Part L of the building regulations
- insulation
- New Build
- gas
- heat pumps
Related items
-
 EU Electrification Action Plan to accelerate heat pump transition
 -
 PYC: fixings through airtight board don’t impact airtightness
 -
 Air tightness training course to launch in Carlow this March
 -
 New Ejot profile cuts thermal bridging losses by 25mm insulation equivalent
 -
Grant integrated heating packages installed for 61 homes in Rathdrum
-
 Why airtightness, moisture and ventilation matter for passive house