


- Government
- Posted
BER data indicates national house building growth – except for Dublin
Significantly more new homes (16.5%) were built in Ireland in the first eight months of 2019 compared to the same period in 2018 – with double digit declines in Dublin cancelled out by strong growth in the rest of the country, new analysis by Passive House Plus indicates.
This article was originally published in issue 31 of Passive House Plus magazine. Want immediate access to all back issues and exclusive extra content? Click here to subscribe for as little as €10, or click here to receive the next issue free of charge
The largest volume of activity continues to be in the commuter counties surrounding Dublin, with 696 new homes built in Meath (+51%), 513 in Kildare (+14%), 396 in Wicklow (+156%) and 234 in Louth (+17.6%), with the whole Leinster region (excluding Dublin) up 49.25% on the first eight months in 2018.
Even larger growth is evident in other provinces, albeit from lower base activity levels. BERs have been issued for 785 homes built this year in Munster (+96.7%), 170 in Connacht (+66.7%), and 92 in the Ulster counties of Donegal, Cavan and Monaghan (+95.7%). As with previous analyses, it’s likely that in the region of three-quarters of new self-builds are not reported in the data – which may mean the figures are particularly conservative for areas with a large amount of one-off housing activity, due to widespread non-compliance in this cohort with the requirement to obtain BERs prior to occupancy.
Meanwhile activity in Dublin is down by 19.5% year-on-year, down from 2,425 BERs for 2018-built homes published from Jan-August last year to 1,954 in 2019 to date.
Activity in Dublin is down across all house types excluding apartments – which are up 28.4% compared to this stage last year, indicating the continuing growth of the build-to-rent market in the capital. Tellingly, semi-ds are down 41.3%, terraced homes are down 27.2% and detached homes 18.8%. The total number of semi-ds and detached homes are lower than by this stage in 2017.
Previous analysis by Passive House Plus in June was showing a marginal increase in output in the year up to mid-May, with this latest analysis now showing strong performance throughout the summer months. The analysis was carried out using SEAI’s National BER Research Tool, which contains details of all published BERs for dwellings in Ireland.
In total, 5,095 BERs have been published to date for homes listed as built in 2019, compared to 4,376 homes by the same stage last year. The standing total for homes built in 2018 is 12,074, a figure which is likely to eventually rise to close to 14,000 new homes, once the lag of late BERs is added, with an estimated additional 3,000 self-builds in breach of the requirement to obtain BERs.
Energy performance trends
Meanwhile, the average primary energy score for new homes in the first eight months of 2019 was 51.85 kWh/m2/yr – compared to 52.76 kWh/m2/yr for the same period in 2018.
While almost all 2019-built homes (99.7%) have achieved an A3 rating or better, this represents a drop of 0.2% on the same period in 2018, with a small number of homes that appear to be far from compliance with Part L of the building regulations including a pair of B2-rated homes and a single C1. Over one-third of properties (33.84%) scored an A2 (+4.7%), while 65.7% scored an A3 (-4.7%).
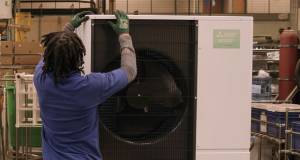
The continuing growth of heat pumps is evident in the data, featuring in 51.9% of new homes (+14.1%), with gas boilers at 38.6% (-13.3%), CHP at 8% (+0.4%), and oil boilers at 1.5% (-0.9%). It’s worth noting that these figures are likely to be unusually exposed to the fact that the vast majority of new one-off houses – a rough estimate would be 75% – don’t have final BERs published. The 2018 standing total for self builds1 included 81.2% heat pumps, 10% oil boilers and 8% gas boilers, indicating that the adjusted figures would cement the domination of heat pumps while lifting oil boilers by a point or so.
Half (49.9%) of 2019-built homes are reliant on natural ventilation, 29% have whole house extract ventilation, 20.6% have heat recovery ventilation and 0.4% positive input ventilation. The natural ventilation figures will likely drop significantly once BERs published later in the year and beyond are included (53.2% and 59.2% respectively of homes built in the first eight months of 2018 and 2017 were naturally ventilated, and the current totals for these two years in full are now 48.1% and 53.1% respectively).
Almost two-thirds (64.5%) of naturally ventilated 2019-built homes – meaning 32.2% of all 2019-built homes – have an air permeability q50 of below 5 m3/hr/ m2 @50Pa. These homes have an average q50 of 3.07. Given the consensus from industry sources that the requirement in Part F of the building regulations (2009) to increase the area of background vents by 40% in naturally ventilated homes with a q50 below 5 is virtually never observed, this cohort of homes is likely substantially under-ventilated, and may pose a threat to occupant health.
The average airtightness test result for 2019-built homes is 2.85, compared to 2.86 for the same period in 2018, based on the 85% of new homes in the first eight months of both 2018 and 2019 which had tests done. Average U-values in 2019-built homes compared to figures for the same period last year are 0.177 (0.173) for walls; 0.121 (unchanged) for roofs; 0.126 (0.129) for floors; 1.22 (1.21) for windows and 1.39 (1.48) for external doors.
In terms of thermal bridging, 72.9% (-5.9%) of 2019-built homes used the ‘acceptable constructions details’ Y value of 0.08, 16.45 used the default value of 0.15 (+7.1%) – a growing cohort of homes which may struggle to meet the surface temperature requirements in Part L 2011 – and 10.7% (-1.1%) used a calculated value of less than 0.08.
- Issue 31
- Housing crisis
- building stock
- Minister Eoghan Murphy
- Department of Housing
- BER
- Building Energy Rating
- Ireland
Related items
-
 EU Electrification Action Plan to accelerate heat pump transition
 -
 A warts-and-all account of a landmark passive house conference
 -
 Life cycle assessment in construction and retrofit
 -
 Bio-based self-build fuses passive principles and clever shading proves heatwave-proof
 -
 Accessible Manchester retrofit delivers comfort and low bills
 -
 Ballymore scheme brings low-cost comfort to private market